Hey everyone ![]()
I’ve just released a small DevTools extension that might be useful for Phaser developers:
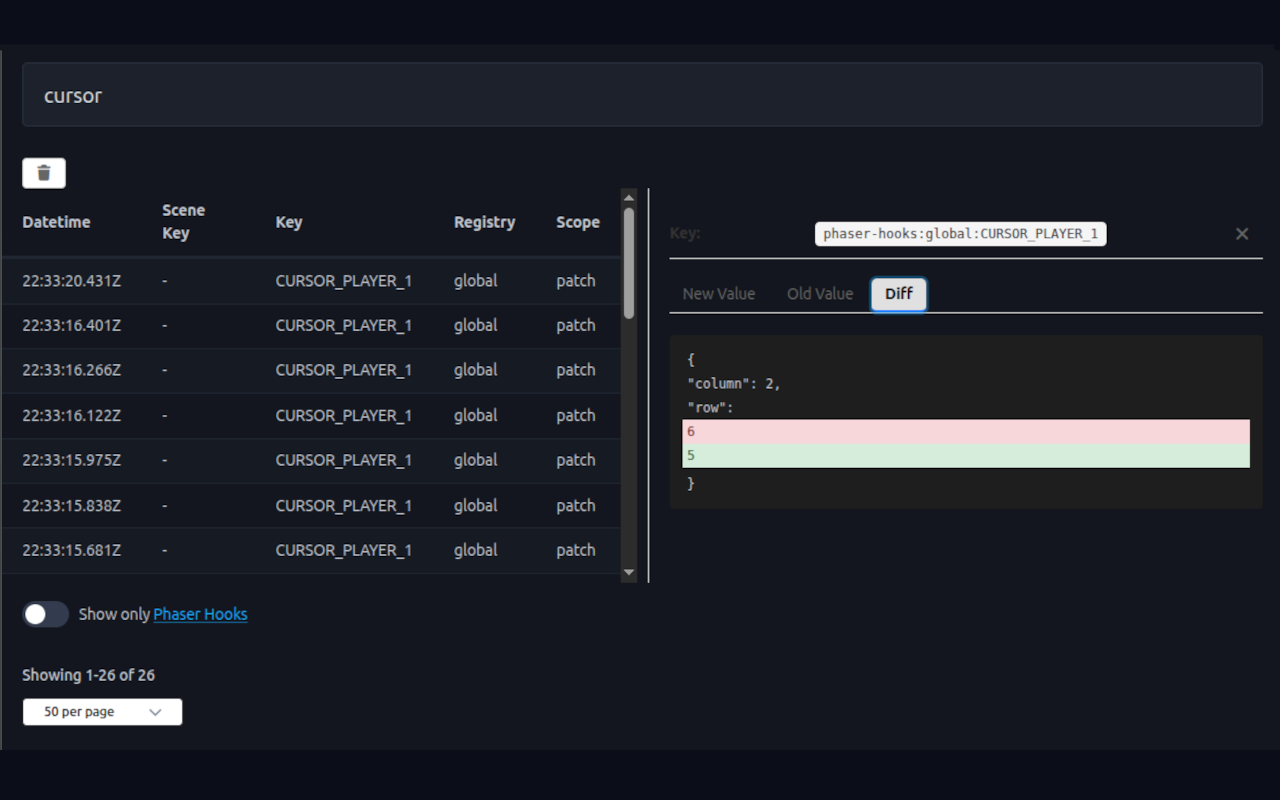
![]() Phaser Data Inspector — a browser DevTools panel that lets you see Phaser’s data changes in real time, similar to how Redux DevTools or Mobx devtools works for React.
Phaser Data Inspector — a browser DevTools panel that lets you see Phaser’s data changes in real time, similar to how Redux DevTools or Mobx devtools works for React.
It hooks into Phaser.Data.DataManager and logs every update that happens in your game, showing:
-
The scene or registry where it happened
-
The key/value being changed
-
The timestamp
-
Optional Phaser Hooks context info (if you use phaser hooks library)
 Why I built it
I found myself constantly debugging with console.log() to track what was happening inside scene.data or the global registry.
So I decided to build a proper DevTools panel to visualize it instead — and it’s been a huge help when debugging complex state logic.
 Download links
![]() Chrome: https://chromewebstore.google.com/detail/phaser-data-inspector/jjcogkkooficbbdhfcamcojmepbjnpdk
Chrome: https://chromewebstore.google.com/detail/phaser-data-inspector/jjcogkkooficbbdhfcamcojmepbjnpdk
![]() Firefox (pending review): https://addons.mozilla.org/pt-BR/firefox/addon/phaser-data-inspector/
Firefox (pending review): https://addons.mozilla.org/pt-BR/firefox/addon/phaser-data-inspector/
 How to use
-
Install the extension
-
Open your game in the browser
-
Open the DevTools → Phaser Data Inspector tab
-
Watch data updates happen in real time

It’s a small open experiment for now - I’d love any feedback, suggestions, or bug reports from the community.
Some prints:


Cheers,
Cassino

